GA4のDebug Viewが表示されないという事例がchrome使用時に散見されている。
前提:
1)Debug Viewの設定がされている
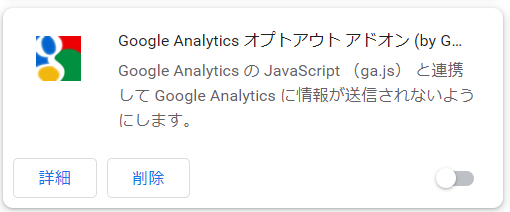
2)Google Analytics のオプトアドオンがオフになっている
3)IPアドレスの除外設定がされていない
このような前提でなお、 GA4のDebug View が表示されない。
アナリティクス(GA4含む)で私が参考にさせていただいている Analitics Mania のJulius Fedorovicius氏によるとそれはバグだとのこと。 GA4 のDebug View がまともに動作しないケースが実際にある。
ではどうすればよいか?下記3点をお勧めしたい。
対策:
1)モバイル(モバイル版chrome)で当該サイトへアクセスする
2)chorome以外のブラウザで当該サイトへアクセスする
3)chrome のゲストモードで当該サイトへアクセスする
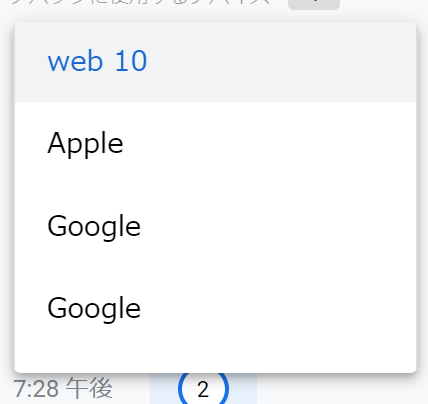
なお、 Debug Viewに表示される「Google」「Apple」等はブラウザの情報をデバイスとして表示させているに過ぎない。
換算表:
デバイス名:ブラウザ
Google:Chrome
Apple:Safari
Microsoft:Edge
等
たまにSharp*** やweb10等の表示も見られるが、デバイス情報( User agent )を偽装させているのでは?と推察する。これはクロームディベロッパーツールで可能。大規模サイトを運営していて、「Google」が100近く表示されている状況なら、ゲストモードで偽装するのも良いだろう。
ディバイスの偽装について
ディベロッパーツールのデバイス設定箇所からEdit
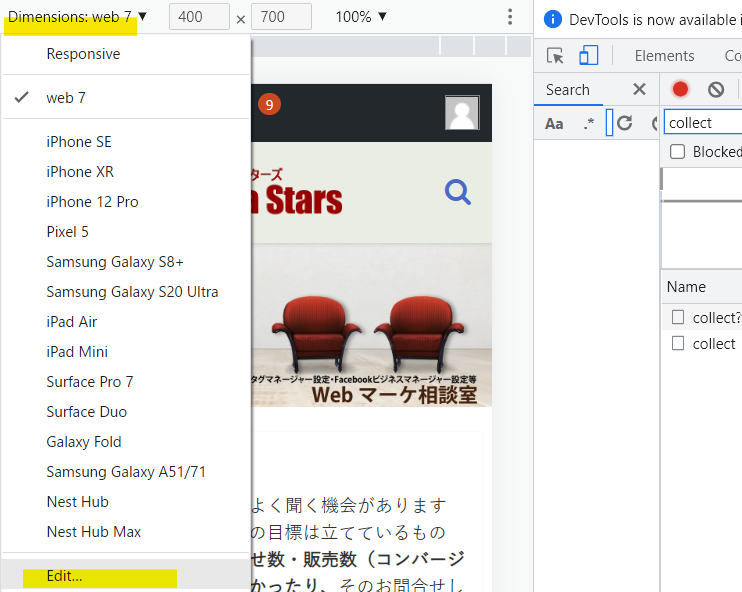
Add Custom device
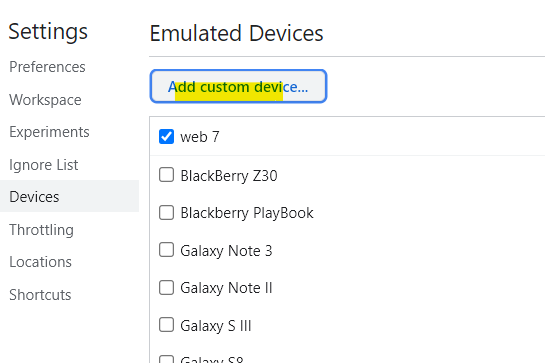
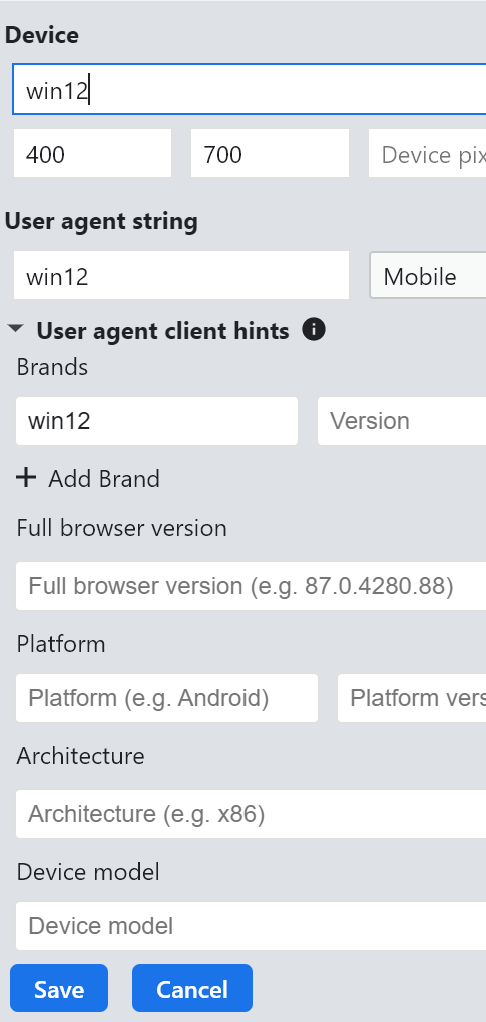
Device、User agent String、User agent clients hit入力
*今回は例として「win12」で入力。
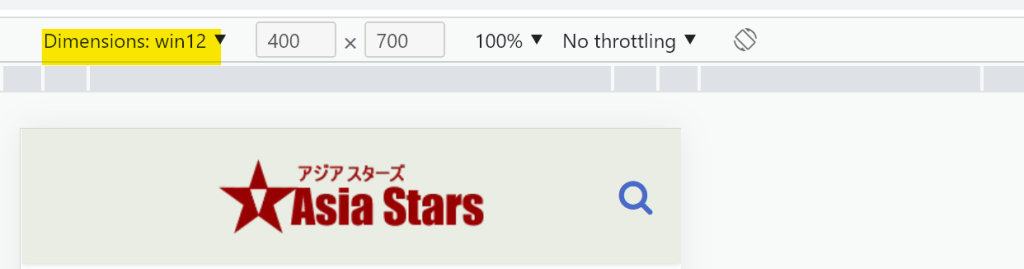
デバイスをwin12にセット
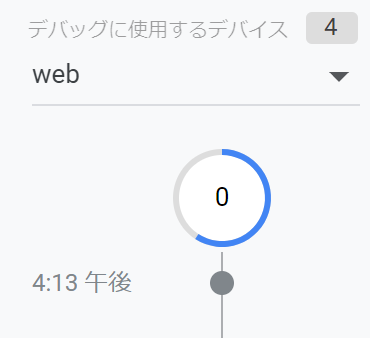
web を確認。不明なブラウザは「web」と表示するようだ。
以上である。